

Clinical outcomes metrics are standardized measures of a patient's actual health result after care, not just whether a protocol was followed. The first move for any healthcare organization is to choose a handful of measures, mixing outcome, process, and balancing types, then pre-specify their exact definitions and data sources before collecting a single data point. Ground that set in established libraries like the CMS Measures Inventory, AHRQ's measure taxonomy, or ICHOM's condition-specific sets rather than inventing your own definitions from scratch.
TL;DR:
- Outcome measures like mortality and readmission rates must be risk-adjusted to account for patient severity and case mix differences across sites.
- Standardized definitions from established libraries should be used to ensure comparability of complication rates, infections, and other clinical endpoints.
- Selecting a limited set of relevant, valid, and reliable metrics linked to patient experience and clinical outcomes avoids dashboard overload and promotes actionable insights.
- Data sources such as EHRs, claims, registries, and patient surveys each have unique strengths and limitations that must be carefully managed through clear specifications and governance.
- Incorporating patient-reported outcomes and ensuring system interoperability are critical for capturing meaningful results and maintaining measurement credibility over time.
Table of Contents
- What Clinical Outcomes Metrics Actually Measure
- The Clinical Outcome Metrics Worth Tracking First
- How to Choose the Right Outcome Metrics for Your Organization
- Where the Data Comes From: EHR, Claims, Registries, and Surveys
- Risk Adjustment and Reading Outcome Signals Correctly
- Building a Measurement Program: Governance and Cadence
- Avoiding the Most Common Measurement Pitfalls
- How The StartupMD Builds Outcomes Programs With Clients
- How Quality Improvement Teams Put Outcome Metrics to Work
- Why Patient Feedback Has to Shape the Metrics Themselves
- Connecting Outcome Data Across Health IT Systems
- Regulatory and Accreditation Requirements to Know
- Where Outcome Measurement Is Headed
- How The StartupMD Helps Healthcare SaaS Leaders Build Outcomes Programs
- Sources
- FAQ
What Clinical Outcomes Metrics Actually Measure
An outcome measure captures what happened to the patient: did they survive, recover function, avoid a complication, report feeling better. That distinguishes it from a process measure, which tracks whether a recommended action occurred, such as whether a diabetic patient received an annual eye exam. Quality measurement typically sorts into four buckets: structure (what capacity and resources exist), process (what was done), outcome (what resulted), and balancing (what unintended effect might have appeared elsewhere in the system). The research on quality measure selection frames outcome measures as the ones that show patient impact directly, which is why regulators and payers increasingly weight them over process compliance alone.
Within outcomes, the field uses a more granular taxonomy called Clinical Outcome Assessments, or COAs. ISPOR's task force on outcomes research organizes COAs into four types:
- Patient-Reported Outcome (PRO): health status reported directly by the patient, with no clinician interpretation, such as a pain score on a validated scale.
- Clinician-Reported Outcome (ClinRO): a professional judgment based on observation or clinical training, like a wound-healing grade assigned by a surgeon.
- Observer-Reported Outcome (ObsRO): an assessment made by someone other than the patient or a trained clinician, often a caregiver, useful when the patient cannot self-report (young children, advanced dementia).
- Performance Outcome (PerfO): a standardized task the patient performs under instruction, such as a six-minute walk test, which produces an objective functional score.
The ISPOR ClinRO task force notes that clinician-reported outcomes are typically used alongside lab values or imaging, giving them a hybrid role between subjective patient experience and objective diagnostics. Getting this taxonomy right matters because a health system that mislabels a ClinRO as a PRO will end up validating it against the wrong reference standard.
Why does patient-centeredness matter here beyond terminology? Value-based contracts, MIPS scoring, and most modern quality frameworks now reward outcomes patients themselves would recognize as meaningful, not just adherence to a checklist. A hospital can hit 100% on a process measure and still produce outcomes patients experience as poor. Outcomes close that gap, which is why they anchor most serious outcomes measurement frameworks used in quality improvement today.
The Clinical Outcome Metrics Worth Tracking First
Not every measure deserves a spot on your dashboard. The ones below show up across specialties because they are well-defined, widely benchmarked, and directly tied to what patients and payers care about.
-
Mortality rate. Numerator: deaths within a defined window (often 30 days post-admission or post-procedure); denominator: eligible patient population. Sourced from EHR discharge data or claims. Caveat: raw mortality without risk adjustment penalizes hospitals that treat sicker patients.
-
30-day readmission rate. Numerator: unplanned readmissions within 30 days of discharge; denominator: index admissions for the same condition. Typically pulled from claims because it captures readmissions to other facilities, which the discharging hospital's own EHR would miss. Definitions of "unplanned" vary by payer, so confirm which specification you are using before comparing across sites.
-
Complication and surgical site infection rates. The Standardised Endpoints in Perioperative Medicine (StEP) initiative established consensus definitions for indicators like surgical site infection at 30 days and postoperative readmission at 30 days, precisely because hospitals were calculating these differently and producing incomparable numbers. Numerator: confirmed infections meeting the StEP or CDC/NHSN definition; denominator: procedures performed. Source: infection control surveillance plus EHR.
-
Length of stay. A blunt but useful efficiency and recovery proxy. Numerator: total inpatient days; denominator: number of admissions. Watch for outlier stays (transplant, trauma) skewing averages; median often tells a cleaner story than mean.
-
Patient-Reported Outcome Measures (PROMs). Instruments like the EQ-5D (generic health status) or SF-36 (broader quality of life) capture what a chart never will: whether the patient feels the intervention worked. Use PROMs when the treatment's success is inherently subjective, such as joint replacement or chronic pain management, and administer at baseline plus at least one follow-up point to detect change.
-
Disease-specific composite endpoints. Cardiology commonly uses MACE (Major Adverse Cardiac Events), oncology tracks recurrence-free or progression-free survival. These composites are efficient for trials but carry a real trap: the research on outcome definition in comparative effectiveness studies shows that varying definitions of MACE, some including revascularization, some not, can shift a study's conclusions substantially. Always document exactly which events count before you start counting.
For every metric on this list, the caveat is the same: definition variance is the single biggest threat to trustworthy comparison. Two hospitals can report "readmission rate" and mean genuinely different things, depending on the definitions they use.
How to Choose the Right Outcome Metrics for Your Organization
A good outcome measure satisfies six criteria: relevance to the population, validity (it measures what it claims to), reliability (consistent results across raters and time), sensitivity to real change, feasibility of collection, and comparability against a benchmark or peer group. Skipping any one of these produces a metric that looks rigorous on a dashboard but misleads decision-makers.
Start by asking whose question you are answering. A payer wants cost and utilization outcomes. A patient wants function and symptom relief. A regulator wants safety events. The guidance on selecting outcomes for comparative effectiveness research recommends translating your improvement question into a clearly defined outcome before picking an instrument, rather than grabbing whatever measure is easiest to pull from the EHR.
Practical selection checklist:
- Does the measure reflect something patients would recognize as improvement, not just administrative compliance?
- Is there a validated instrument or standard definition already available (ICHOM set, AHRQ category, StEP indicator) rather than a homegrown one?
- Can your current data infrastructure capture it reliably without adding significant manual chart abstraction?
- Does it pair with at least one process measure, so you can see whether a change in outcome is actually attributable to a change in care delivery?
- Have you identified at least one balancing measure to catch harm the outcome metric itself would miss?
Resist the urge to track everything. A quality improvement team monitoring 40 indicators produces noise, not insight, and clinicians tune out dashboards that never change their daily decisions. Tie every metric to a specific improvement aim, following a Plan-Do-Study-Act cycle, so each number has a decision attached to it.
Pro Tip: If a measure has been on your dashboard for six months and no one has changed a workflow because of it, retire it. A shorter list that people actually act on beats a comprehensive one that gets ignored.
Where the Data Comes From: EHR, Claims, Registries, and Surveys
Every outcome metric is only as trustworthy as the pipeline feeding it. Each data source carries distinct tradeoffs.
Electronic health record (EHR) data offers granularity and real-time access but suffers from inconsistent structured fields. Free-text notes bury outcomes that never get coded, and different clinicians document the same event differently.
Administrative claims data captures events across care settings, including readmissions to other facilities, which makes it the standard source for measures like 30-day readmission. Its weakness: claims reflect billing logic, not clinical nuance, and lag real time by weeks or months.
Clinical registries, such as disease-specific or procedural registries, offer the richest clinical detail and often come with built-in risk-adjustment models. They demand dedicated data abstraction staff, which smaller organizations may not have budgeted for.
Patient surveys are the only reliable route to PROMs. Response rates and administration timing (pre-op versus 90 days post-op, for example) heavily influence what the data shows, so cadence has to be planned as carefully as the instrument itself.
Device and remote monitoring data (wearables, home blood pressure cuffs, continuous glucose monitors) adds objective, high-frequency signal for chronic disease management, but integrating it into a clinical workflow requires interoperability work most organizations underestimate.
Before collecting anything, specify the exact variable name, the inclusion and exclusion criteria, and the reporting cadence in writing. A measure defined loosely as "readmissions" invites every downstream user to interpret it differently. Data governance, meaning a named owner responsible for definitions and data quality checks, is what separates a credible measurement program from a spreadsheet that quietly drifts out of alignment with itself. Even a lean team can run this well: one data analyst, one clinical owner, and a defined monthly extraction cycle is often enough to start.
Risk Adjustment and Reading Outcome Signals Correctly
Raw outcome numbers mislead more often than they inform, because patient populations are not identical across sites or time periods. A hospital serving a higher proportion of frail, elderly, or socioeconomically disadvantaged patients will show worse raw mortality and readmission rates even with excellent care. Risk adjustment corrects for this by accounting for case mix before comparing performance.
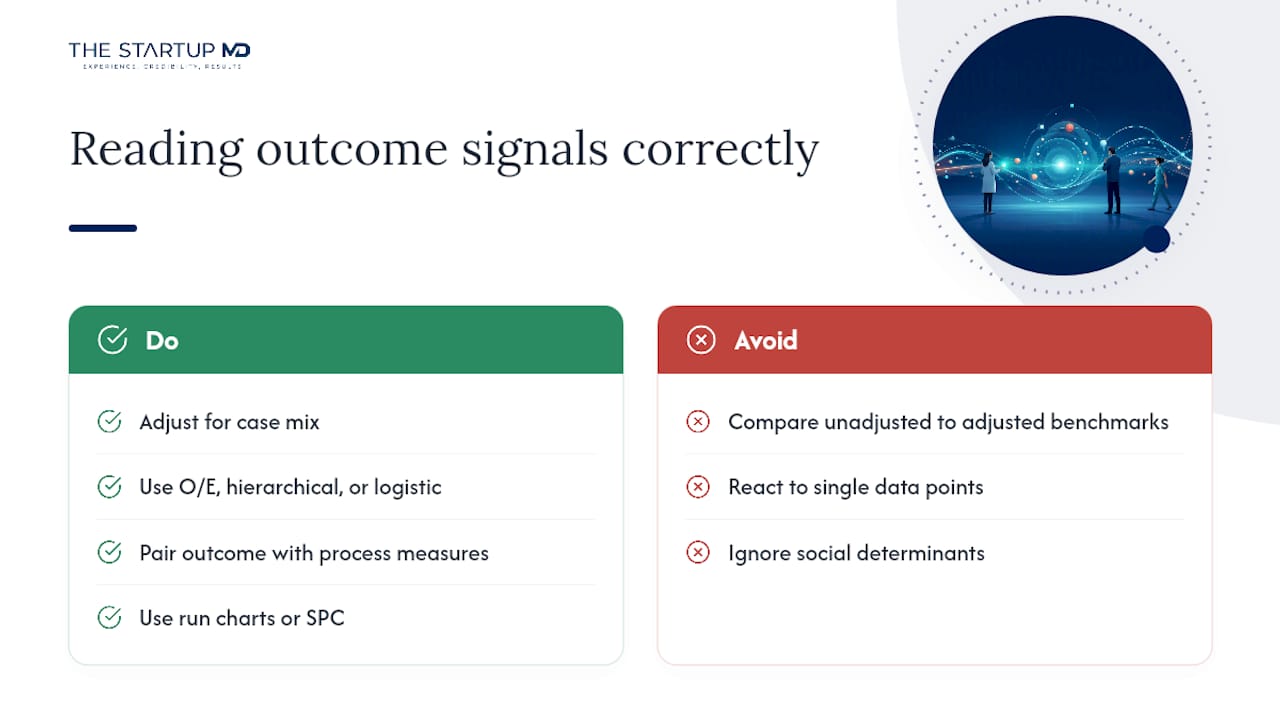
Common statistical approaches include observed-to-expected (O/E) ratios, where expected events come from a validated risk model; hierarchical (multilevel) regression, which accounts for clustering of patients within providers; and standard logistic regression for binary outcomes like 30-day mortality. Confounding is not limited to clinical severity. Social determinants of health, including housing stability, transportation access, and insurance status, can shift outcomes independent of care quality, which is why the research on outcome versus process measures recommends pairing outcome measures with process measures to help isolate what is actually attributable to clinical action.
Benchmarking against peer groups, national registries, or ICHOM standard sets gives outcome numbers context, but only when the comparison group shares a similar case mix and definition. Comparing your unadjusted complication rate to a national ICHOM benchmark calculated with adjustment is not a fair fight.
Run charts and statistical process control (SPC) remain the most practical tools for telling real improvement from random noise over time, according to NHS Improvement's guidance on measurement for improvement. A single month's dip or spike rarely justifies action; a sustained shift crossing standard SPC rules (a run of points on one side of the median, for instance) usually does.
Learning to read a run chart before reacting to a single data point is one of the most underused skills in clinical leadership.
Building a Measurement Program: Governance and Cadence
An outcomes program without clear ownership dies quietly, buried under competing priorities. Structure it in stages.
-
Assign governance roles. Name a clinical owner accountable for the measure's meaning, a data steward responsible for pipeline integrity, and an executive sponsor who keeps the program funded and visible.
-
Specify every measure in writing. Document the exact definition, numerator and denominator, data source, collection frequency, and any exclusion criteria. This specification should read like a mini-protocol, not a one-line dashboard label.
-
Set reporting cadence by audience. Frontline clinical teams need weekly or monthly operational views tied to specific patients or units. Executives and boards need quarterly rollups with trend lines and risk-adjusted comparisons, not raw counts.
-
Track balancing measures alongside every outcome. If you push a new discharge protocol to cut length of stay, also watch readmission rates and staff overtime hours. The literature on quality measure design is explicit that balancing measures exist to catch harm an outcome metric alone would miss, whether that harm shows up as clinician burden, equity gaps across patient subgroups, or unplanned cost increases.
Pro Tip: Review your balancing measures at the same meeting where you review your primary outcome, not in a separate report three weeks later. Unintended consequences get missed when they are tracked on a different clock than the metric that triggered them.
Building this governance structure well is closely tied to how a clinical messaging framework presents baselines and change to stakeholders. A measure with perfect specification still fails if leadership cannot interpret what moved and why.
Avoiding the Most Common Measurement Pitfalls
Definition heterogeneity is the quiet killer of outcome measurement credibility. Two cardiology programs can both report "MACE reduction" while counting entirely different event sets, one including revascularization, one excluding it, producing numbers that cannot be honestly compared. The same problem shows up with "readmission," "complication," and "recurrence" across nearly every specialty.
Surrogate endpoints (a lab value or imaging finding used as a stand-in for a clinical outcome) are acceptable when a validated link to the real outcome exists and when direct measurement is impractical. They become a problem when treated as equivalent to the clinical outcome itself without that validation.
Mitigation is straightforward in principle, harder in practice:
- Adopt an existing standard library (ICHOM condition sets, StEP perioperative indicators, or the CMS measure specifications) instead of drafting your own definition.
- Pre-specify every endpoint, including the instrument, measurement frequency, and any threshold for "success," before data collection begins, a discipline NCATS' toolkit on outcome measurement treats as essential to avoiding bias.
- Pilot test the measure on a small sample before full rollout to catch ambiguous documentation or missing data fields early.
- Before rollout, confirm the measure has a validated instrument, a written specification, an identified data owner, and at least one paired process or balancing measure.
How The StartupMD Builds Outcomes Programs With Clients
Every engagement follows the same broad arc: discovery, measure specification, data pipeline design, a pilot period, then scale and governance handoff. Discovery identifies which two or three outcomes actually matter to the organization's patients and payers, not the longest list a team can generate in a whiteboard session.
For early-stage healthcare SaaS companies, a minimal starter package often includes one core outcome measure, one process measure, and one balancing measure, collected monthly through existing product or EHR data with no new infrastructure required. For hospital quality improvement teams, the package typically expands to include a risk-adjusted outcome, a linked process measure, a PROM administered at two time points, and a balancing measure reviewed at the same cadence.
The pitfalls clients bring to The StartupMD are consistent: measures defined too loosely to compare over time, dashboards with too many indicators to act on, and PROM programs that collect data nobody analyzes. Fixing this is less about new technology and more about specification discipline and governance clarity, the same principles behind a strong clinical use case for a SaaS product.
How Quality Improvement Teams Put Outcome Metrics to Work
An outcome metric only earns its place on a dashboard when it drives a decision. Quality improvement teams typically anchor a PDSA (Plan-Do-Study-Act) cycle around one primary outcome measure, then use a linked process measure to test whether a specific workflow change actually moved that outcome.

A hospital reducing central line infections, for example, tracks the infection rate as the outcome while monitoring line-insertion checklist compliance as the process measure. If compliance rises but infections do not fall, that mismatch tells the team the checklist itself, not adherence, needs revision. This pairing is what separates outcome measurement used for improvement from outcome measurement used purely for public reporting; the former demands a tight feedback loop between data and frontline action, usually reviewed in cycles of weeks rather than quarters.
Small-scale tests matter here. Rather than rolling a new protocol out system-wide, QI teams typically pilot on one unit, read the run chart for a sustained signal, then expand. This keeps the risk of a poorly designed measure contained and gives clinicians confidence that the metric reflects something real, not statistical noise from a small sample.
Why Patient Feedback Has to Shape the Metrics Themselves
Outcome measurement loses credibility fast when patients never see themselves in the numbers being tracked. A hospital can report excellent 30-day mortality and readmission rates while patients experience long recovery times, unaddressed pain, or confusion about their care plan, gaps no claims-based measure will ever surface.
Structured patient feedback, through PROMs, satisfaction surveys, or direct advisory councils, closes that gap by putting the patient's own assessment of the outcome into the measurement set itself, as explained in this patient testimonials healthcare website guide for practices. This is precisely why PROs sit as a distinct category within the COA taxonomy rather than being folded into clinician-reported measures: patients and clinicians frequently rate the same recovery differently.
Engagement also improves data quality. Patients who understand why a survey matters, and see that responses lead to visible changes, respond at higher rates and with more accurate self-reports. Tools that support structured patient engagement make this feedback loop more consistent, particularly for chronic disease populations where outcomes unfold over months rather than a single encounter. Organizations serious about outcomes measurement increasingly treat patient advisory input as part of measure selection itself, not just a data collection afterthought once the metric is already locked in.
Connecting Outcome Data Across Health IT Systems
An outcome metric is only as useful as the systems that can access it. Interoperability, meaning the ability to move data reliably between an EHR, a registry, a claims platform, and a patient survey tool, determines whether outcomes measurement scales past a single pilot unit or stays trapped in a spreadsheet.
Standards like HL7 FHIR increasingly allow structured outcome data, lab values, PROM scores, discharge status, to move between systems without manual re-entry. For healthcare SaaS companies building products that touch clinical workflows, this matters directly: a product that cannot export outcome data in a standard format creates friction for the health system customers trying to fold that data into their own quality reporting.
Practical integration usually starts small: mapping which outcome fields exist in the EHR today, identifying gaps that require a separate registry or survey tool, and confirming that data governance rules (who can access what, and how identifiers are protected) are settled before the pipeline goes live. Skipping this step is the single most common reason outcomes programs stall after a promising pilot. Teams discover, months in, that the data they need lives in three disconnected systems with no clean way to reconcile it.
Regulatory and Accreditation Requirements to Know
Outcome measurement is not purely a quality improvement exercise; it is increasingly a compliance obligation. CMS ties portions of hospital reimbursement to outcome measures reported through programs like the Hospital Readmissions Reduction Program, using specifications drawn from the CMS measure taxonomy. Accrediting bodies such as The Joint Commission require documented performance measurement as part of ongoing accreditation, with outcome data forming part of that evidence base.
For clinical trials and regulated research, the FDA and international bodies expect outcome measures, particularly those used as primary endpoints, to be pre-specified in the study protocol before enrollment begins. This is the same pre-specification discipline described earlier: instrument, frequency, and threshold locked in writing, not adjusted after seeing early results.
Healthcare SaaS companies building products that touch clinical outcome data should treat these requirements as design constraints from day one, not compliance work bolted on after launch. A product that cannot produce an auditable, well-defined outcome measure will struggle in procurement conversations with health system buyers who face their own accreditation and CMS reporting obligations.
Where Outcome Measurement Is Headed
Healthcare leaders spend too much energy chasing measures that look impressive on a slide and too little verifying that those measures reflect what patients actually experience. That is backwards. The organizations getting this right in 2026 are the ones treating measurement as an organizational capability, not a reporting task assigned to whoever has bandwidth this quarter.
Three priorities matter most for the year ahead: build outcome sets around what patients themselves would call success, invest in the interoperability work that lets outcome data move cleanly between systems, and stay honest about how social determinants confound your comparisons before you act on a benchmark gap. None of this requires exotic technology. It requires discipline, a named owner, and a willingness to retire measures that no longer earn their place.
— Paul Bergeron MD, MBA
How The StartupMD Helps Healthcare SaaS Leaders Build Outcomes Programs
Designing a measurement program that survives contact with a real clinical workflow takes more than a spreadsheet template. It takes someone who has sat on both sides of the table: the clinical side that knows what a valid endpoint looks like, and the business side that knows what investors and health system buyers actually ask for during diligence.

The StartupMD provides fractional Chief Medical Officer support and clinical strategy consulting built specifically for healthcare SaaS companies and digital health startups, not general business advisory dressed up in healthcare language. If your team is building a product where outcome data will drive procurement conversations, clinical validation, or investor confidence, bringing in fractional clinical leadership early is usually far more cost-effective than discovering measurement gaps during a Series A due diligence process. Consider building internally only once you have a dedicated clinical owner with the bandwidth to specify, govern, and defend your measures over time; most early-stage teams do not have that person yet. Review how a well-structured healthcare SaaS revenue model evaluation accounts for clinical outcome credibility, and reach out to discuss where your current measurement approach may be leaving value on the table.
This article is general information, not a substitute for advice from a qualified doctor. Consult a qualified healthcare professional about your own circumstances before acting on anything here.
Sources
- Quality Measures: Types, Selection, and Application in Health Care Quality Improvement Projects
- Outcome definition and measurement - Developing a protocol for observational comparative effectiveness research: A user's guide
- How to guide for measurement for improvement (NHS Improvement)
FAQ
What are clinical outcome measures?
Clinical outcome measures are standardized indicators of a patient's actual health result, such as survival, symptom relief, or functional recovery, as distinct from process measures that track whether a recommended action was performed.
What are the key performance indicators healthcare organizations track most?
Common healthcare KPIs include mortality rate, 30-day readmission rate, average length of stay, complication and infection rates, and patient-reported outcome scores like EQ-5D or SF-36, each tied to a specific numerator, denominator, and data source.
What outcome metrics are used most often across specialties?
Mortality, 30-day readmission, surgical site infection, PROMs, and disease-specific composites like MACE or recurrence-free survival appear across the widest range of specialties because standardized definitions already exist for them.
What performance metrics should hospitals prioritize tracking?
Hospitals generally start with mortality, readmission, complication rates, length of stay, and at least one PROM, then add balancing measures like staff burden or equity gaps once the core outcome set is stable and well-defined.
How is an outcome measure different from a process measure?
An outcome measure shows what happened to the patient, while a process measure shows whether a recommended clinical action occurred; pairing the two helps isolate whether a change in outcome is actually attributable to a change in care delivery.