

For founders and investors, preventive care economics means packaging verifiable clinical impact into payer-friendly, budget-safe payment constructs: bundles, outcome-aligned payments (OAPs), or limited-risk guarantees. Payers do not buy prevention on principle; they buy it when you show a credible budget-impact model, attributable clinical outcomes, and a contract structure that limits their downside.
Three things determine whether your deal closes:
- Payer decision hinge: CFOs approve contracts based on near-term budget impact and PMPM trend reduction, not theoretical long-term ROI. Your model must speak their language.
- Contract levers that unlock buy-in: Bundled or fixed-fee structures and OAPs reduce budget volatility. Staged payments with capped downside get you past the CFO's risk committee.
- Operational evidence required immediately: Validated clinical measures (HbA1c, BP), attributed enrollment, and a fixed reporting cadence are table stakes before any payer signs.
Your immediate next step: build a 3-year budget-impact model benchmarked against your target payer's medical trend and high-cost claimant profile.
Table of Contents
- Why payers evaluate prevention differently than you expect
- Payment models that reduce payer friction
- A worked 3-year break-even model you can adapt
- Operational requirements payers will audit
- What payers will ask in procurement
- How an ACCESS OAP contract affects your cashflow
- Key Takeaways
- The gap most founders miss in preventive care economics
- The StartupMD helps you build the payer case, not just the product
- Useful sources and further reading
Why payers evaluate prevention differently than you expect
Payers prioritize annual budget solvency over multi-year ROI. That gap is the central challenge of preventive healthcare cost analysis for any founder.
Budget impact measures the change in annual claims spend and PMPM cost within the payer's current contract year. Total Cost of Care (TCOC) captures the full downstream effect across all utilization categories over multiple years. CFOs and actuaries care about both, but they approve contracts based on budget impact first. TCOC framing earns credibility; budget impact closes deals.
The Society of Actuaries recommends that startups present a Total Risk Analysis to payers, using actuarial budget-impact framing and a Value Stack rather than raw engagement metrics. Actuarial teams discount models that lead with daily active users or completion rates without mapping those figures to attributable claim reductions or high-cost claimant impacts.
Medical trend and high-cost claimant volatility are the two levers CFOs watch most closely. A single high-cost claimant can shift a small employer's PMPM by $30–$50. Prevention programs that demonstrably reduce that tail risk get attention fast.
Pro Tip: Map your clinical outcomes directly to payer KPIs. HbA1c reduction maps to avoided diabetes complications and inpatient admissions. BP control maps to reduced stroke and cardiac event costs. Build a one-page crosswalk showing outcome → utilization category → PMPM impact before your first payer meeting.
Payment models that reduce payer friction
Bundled and fixed-fee structures reduce budget volatility for payers. OAPs go further by tying your revenue directly to clinical outcomes, which aligns incentives and reduces the payer's perceived risk.
CMS's ACCESS model (Advancing Chronic Care with Effective, Scalable Solutions), launching July 2026, tests OAPs with per‑beneficiary annual payments of $90–$420. Fifty percent of each annual payment is withheld until year-end reconciliation. The ACCESS RFA specifies that the non-withheld 50% is distributed in monthly installments over the first six months, the initial Outcome Attainment Threshold (OAT) is set at 50% for the first 18 months, and the Clinical Outcome Adjustment is capped at a 50% reduction. CMS explicitly links these payments to control or improvement in BP, weight, and HbA1c.
Milliman's analysis notes that ACCESS OAP costs may be temporarily excluded from ACO financial benchmarks in year one, but later inclusion means ACOs must quickly adapt or risk benchmark erosion.
| Contract Form | Payer Fit | Evidence Required | Time-to-Break-Even | Reporting Burden | Risk Allocation |
|---|---|---|---|---|---|
| FFS / per-service | Commercial, Medicaid | Minimal | 1–2 years | Low | Payer bears all |
| Shared savings | Medicare Advantage, ACOs | Moderate (utilization data) | 2–3 years | High | Shared |
| Bundled / fixed-fee | All payer types | Moderate (completion + clinical) | 1–3 years | Moderate | Vendor bears cost overrun |
| OAP (ACCESS-style) | Medicare, MA, progressive commercial | High (validated clinical endpoints) | 2–4 years | High | Shared; capped at 50% reduction |
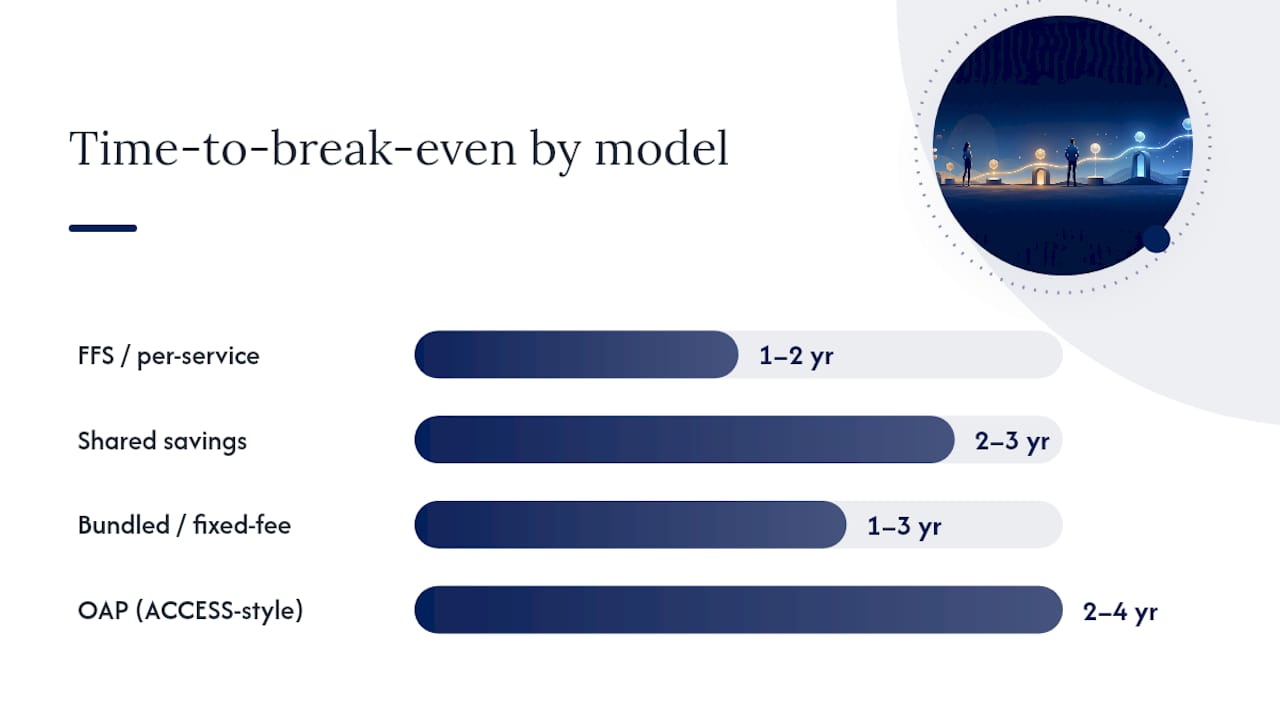
Withholds and clawbacks are the operational reality of OAP contracts. Negotiate a risk cap (the ACCESS model's 50% Clinical Outcome Adjustment cap is the template), partial reconciliation triggers at 6 months, and explicit definitions of what constitutes an "achieved" outcome before signing.
A worked 3-year break-even model you can adapt
Break-even depends on four variables: enrollment size, completion and outcome attainment rate, per-member program cost, and savings realized in high-cost utilization categories.
A Markov-model analysis of a digital behavioral counseling program showed a 3-year break-even point with positive ROI extending through years 5 and 10, validating this as a realistic planning horizon for payer-facing models.
Model inputs (example values):
| Input | Example Value |
|---|---|
| Eligible population | 200–500 members |
| Condition prevalence | completion and outcome attainment rates vary |
| Expected program uptake | 40% (300 enrolled) |
| OAP amount per beneficiary | $250 (mid-range; within ACCESS range) |
| Withheld share | 50% withheld |
| Projected avoided admissions (Year 1) | 8 |
3-year projection (base / pessimistic / optimistic):
| Year | Base Net Savings | Pessimistic (60% OAR) | Optimistic (90% OAR) |
|---|---|---|---|
| Year 1 | ($18,000) | — | — |
Methodology note: Base assumes 75% OAR vs. 50% OAT, 8 avoided admissions in Year 1 growing 20% annually, and full withheld release at reconciliation. Pessimistic assumes OAR just above OAT with partial Clinical Outcome Adjustment. Optimistic assumes OAR exceeding OAT by 40%. Sensitivity: a ±10% shift in completion rate moves Year 3 net savings by approximately $18,000–$22,000.
Operational requirements payers will audit
Payers require auditable, attributed measures delivered on a fixed cadence. Missing capabilities kill deals before they start.
Minimum capabilities checklist:
- Validated clinical measures: — Standardized collection protocols for HbA1c, BP, weight; NCQA or CMS-aligned measure specifications
Pro Tip: Start with a minimal evidence architecture: daily event logs, a monthly reconciliation file formatted to your target payer's spec, and a pre-agreed third-party measurement plan. Lock this infrastructure before your pilot launches. Retrofitting it after enrollment starts is expensive and creates attribution gaps that payers use to reduce reconciled payments.
Integrating your program into clinical workflows and physician engagement is what separates programs that sustain enrollment from those that plateau at 30% completion.
What payers will ask in procurement
The single most important prep item is a short procurement dossier pairing clinical impact with budget-impact modeling and an audit plan.
Likely payer procurement questions:
- What is your evidence base, and does it match our covered population?
- How do you attribute outcomes to your program vs. secular trend?
- What utilization changes do you project, and in which categories?
- What data will you share, at what cadence, and under what data use agreement?
- What are your audit rights, and who conducts third-party validation?
- What stop-loss or reinsurance adjustments apply if high-cost claimants skew results?
- What happens if enrollment falls below the contracted minimum?
Contract red flags to avoid:
- Unlimited downside without a cap on Clinical Outcome Adjustment reductions
- Vague outcome definitions (e.g., "improved health" without a validated measure)
- Attribution windows shorter than 12 months for chronic disease programs
- No minimum volume guarantee, leaving payers free to enroll only low-risk members
- Missing audit rights or data access clauses
Pilot proposal template (drop into an RFP):
- Population: 200–500 attributed members with confirmed condition prevalence
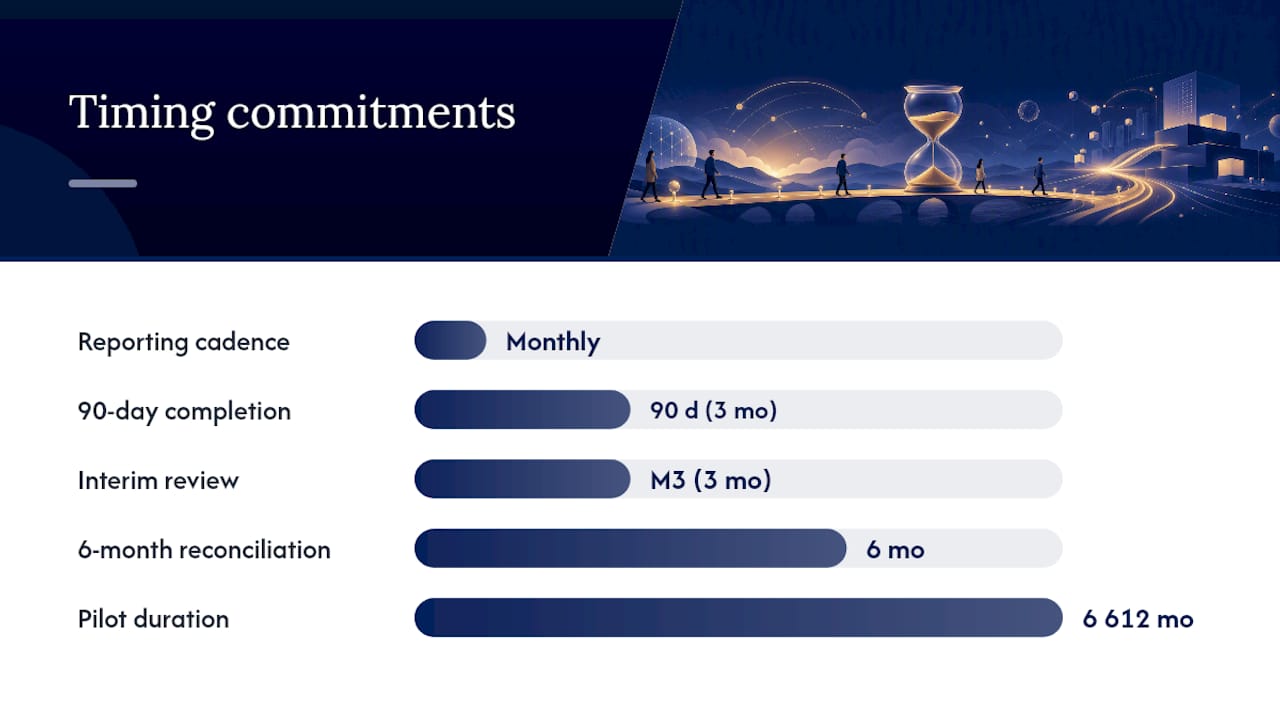
- Duration: 6–12 months with interim review at month 3
- Primary metrics: HbA1c reduction ≥0.5%, BP control rate, 90-day completion rate
- Reporting cadence: Monthly operational report, 6-month interim reconciliation
- Payment structure: 50% upfront, 50% at reconciliation based on agreed OAR vs. OAT
- Data sharing: Monthly claims extract under BAA, third-party audit at program end
How an ACCESS OAP contract affects your cashflow
ACCESS-style OAPs improve revenue predictability, but only if you hit OAT thresholds. Here is what the numbers look like across three scenarios.
Example: 300 enrolled beneficiaries, $250 OAP per beneficiary, $75,000 total annual OAP.
| Month | Cash Received | Cumulative Received |
|---|---|---|
| Month 2–6 | —/month | — |
| Month 7–12 | $0 (withheld period) | — |
| Year-end reconciliation (OAR ≥ OAT) | — released | $75,000 |
| Year-end reconciliation (OAR below OAT, 50% adj.) | — | $56,250 |
The 50% Clinical Outcome Adjustment cap means your worst-case reconciliation returns 75% of the total annual OAP ($56,250 of $75,000), per the ACCESS RFA mechanics.
Implementation implications:
- Enroll members in cohorts to smooth the reconciliation calendar and avoid a single year-end cliff
- Mid-year reconciliation effects on cashflow require a 6-month operating reserve equal to the withheld amount
- Negotiate a partial release trigger at month 6 if interim clinical markers are on track
Key Takeaways
Preventive care economics for digital health startups requires translating clinical outcomes into payer-facing budget-impact models, structured around OAP or bundled contracts with staged payments and capped downside risk.
| Point | Details |
|---|---|
| Budget impact closes deals | Payers approve contracts on near-term PMPM impact, not long-term ROI; model both but lead with budget impact. |
| ACCESS OAP is the structural template | $90–$420 per beneficiary annually, 50% withheld, reconciled against OAR vs. OAT; commercial payers will replicate this logic. |
| 3-year break-even is realistic | A Markov-model analysis of digital behavioral counseling validated a 3-year break-even; build your model to that horizon. |
| Operational infrastructure is non-negotiable | Unique beneficiary ID, EHR linkage, validated measures, and a monthly reconciliation file must exist before pilot launch. |
| The StartupMD accelerates payer readiness | Fractional CMO and advisory services from The StartupMD cover financial-model development, pilot design, and payer contracting support. |
The gap most founders miss in preventive care economics
Most founders I work with understand that payers want outcomes. What they underestimate is how specifically payers want those outcomes packaged. A strong clinical result buried in a PDF deck does not move a CFO. A budget-impact model showing $42 PMPM reduction in a matched cohort, with a reconciliation methodology an actuary can audit, does.
The shift toward performance-first contracting is accelerating. ACCESS is not an isolated CMS experiment. It is a signal that outcome-linked payment structures will become the baseline expectation across Medicare Advantage and, within two to three years, progressive commercial payers. Startups that build measurement and reconciliation capabilities now, before they need them to close a deal, will negotiate from strength. Those that retrofit them under contract pressure will lose margin and credibility simultaneously.
The other underestimated variable is timing. Payers think in budget years. Your program's ramp-up period, the 60–90 days before enrolled members generate meaningful clinical data, is a cost line with no offset. Model it explicitly. Show the payer when TCOC impact materializes, not just that it will. That specificity is what separates a credible healthcare SaaS revenue model from a pitch deck.
The StartupMD helps you build the payer case, not just the product
Building a prevention product is one challenge. Translating it into a contract a payer CFO will sign is another. The StartupMD provides fractional CMO services, payer readiness audits, financial-model development, and pilot and contracting support specifically for healthcare SaaS founders at this stage.
If you are preparing for a first payer conversation or structuring a pilot proposal, The StartupMD can audit your evidence package, build the budget-impact model, and design the OAP-aligned contract structure that reduces CFO friction. This is not generic consulting. It is clinical and commercial expertise applied to the exact problem you are solving.
Review The StartupMD's clinical advisory services or explore the healthcare SaaS revenue model evaluation to see where your model stands before your next payer meeting.
Useful sources and further reading
- ACCESS model (CMS innovation models)
- Improving access to technology-supported care with outcome-aligned payments (CMS blog)
- CMMI ACCESS model for providers, life sciences & ACOs (Milliman)
- Digital health technologies and stakeholder incentives in type‑2 diabetes prevention (PMC)
- Closing the analytical loop: Peterson Health Technology Assessments and actuarial methods (SOA report)